
Define the time and product boundary
Overall equipment effectiveness compares productive output with the production time that was planned. Before calculating it, define the machine or line, the scheduled period, which products are included and what counts as a good unit. Inconsistent boundaries make shifts impossible to compare.
OEE is commonly expressed as availability multiplied by performance multiplied by quality. The result is useful because each factor points to a different type of loss. The total score matters less than a consistent method and the actions taken from the underlying data.
Calculate availability, performance and quality
Availability compares actual run time with planned production time. Record stops for breakdowns, material shortages, setup and other events according to a defined status model. Do not change classifications from shift to shift to protect the score.
Performance compares actual production rate with the ideal validated cycle while the line is running. Quality is good count divided by total count, with rework treated consistently. Multiplying the three percentages shows the share of planned time that produced good parts at the defined rate.
- Availability: run time divided by planned production time
- Performance: ideal cycle time times total count, divided by run time
- Quality: good count divided by total count
- OEE: availability times performance times quality
Adapt the model to a multi-stage line
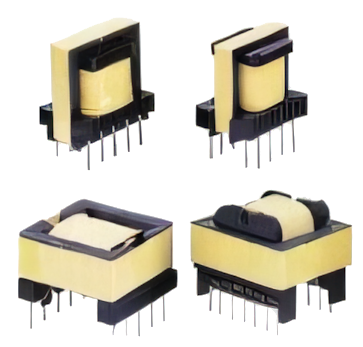
A coil or transformer line may include winding, taping, soldering and testing with different cycles. Define the line output at the final good-part point and retain station-level stop reasons so the constraint is visible. Averaging separate machine percentages can hide the process that limits the complete line.
Track minor stops and reduced speed as performance losses rather than allowing them to disappear between downtime and output reports. Record rejects at the operation where the defect is detected and, where possible, the operation that created it.
Use OEE to prioritize—not to rank people
Review the largest loss categories and investigate recurring reasons. A lower score during a planned product launch can still represent useful learning, while a high score on an easy product mix may not show greater capability. Compare like conditions and look at trends.
Automation controls can provide run status, counts and test results, but operators still add context for material and recovery events. PME production-line discussions can include the signals needed for sensible performance reporting when data requirements are defined during the project.
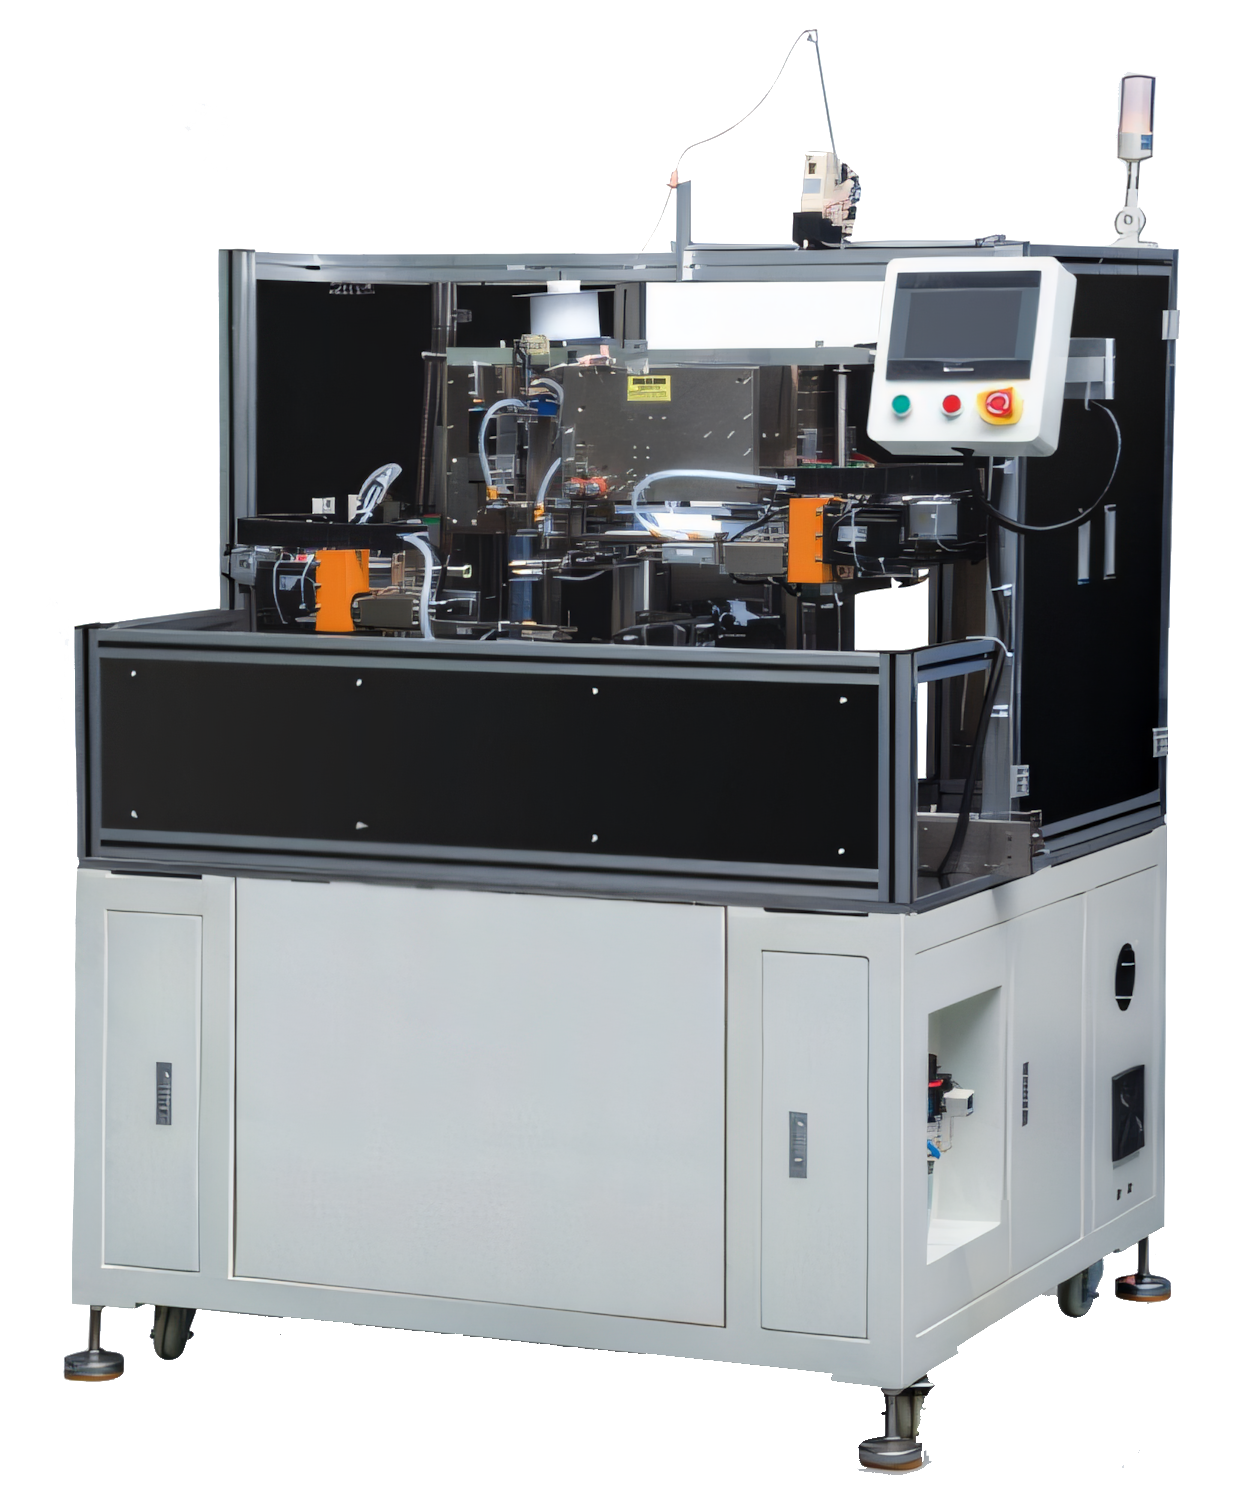
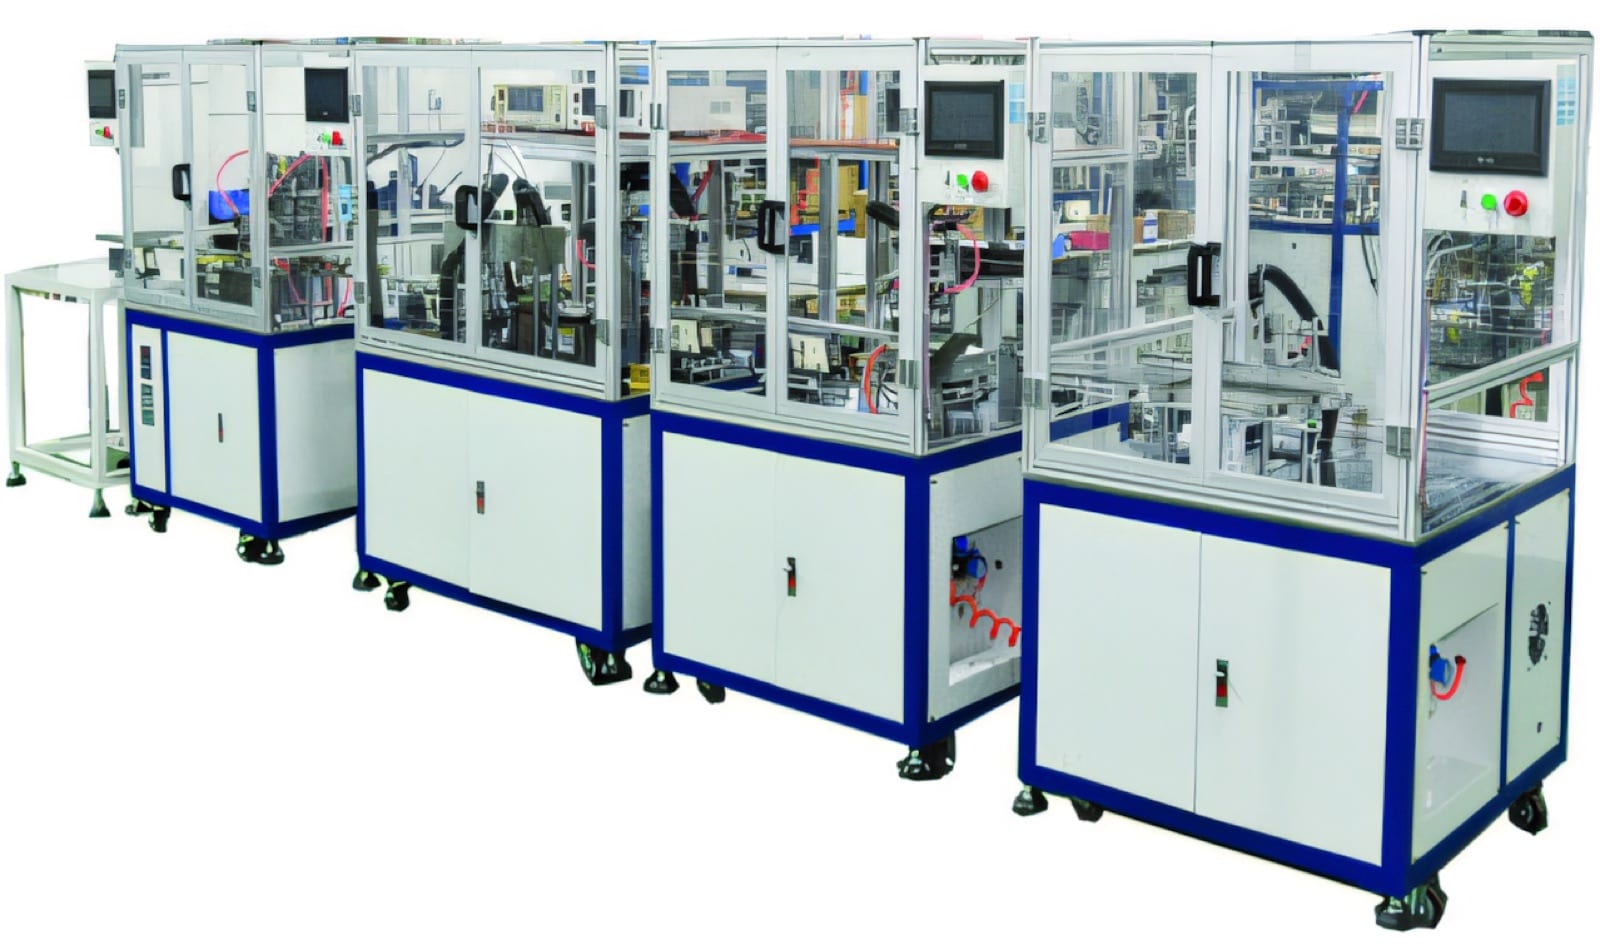
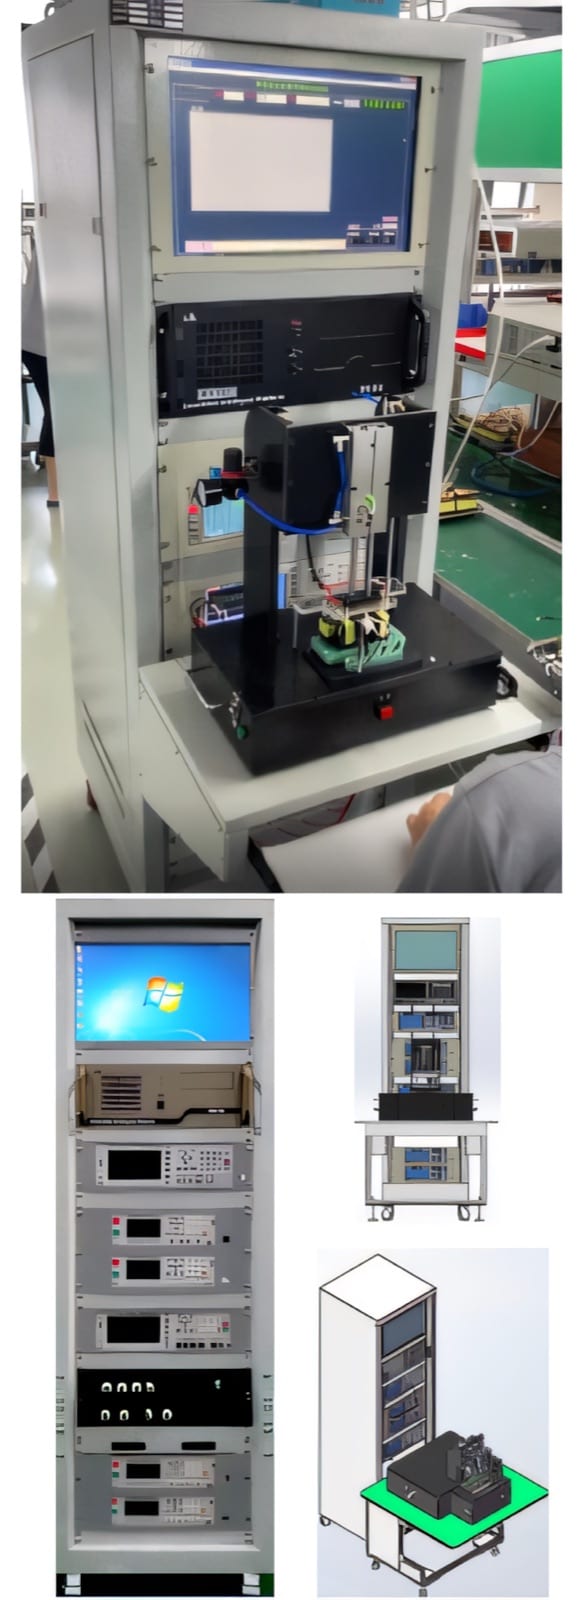
Relevant machinery for this process
Explore PME equipment that can support the operations discussed in this guide. Final machine selection should be confirmed against your component, materials and target output.
Plan the next step
Discuss your component and production target with PME.
Share a drawing, sample, current process and expected output. We can help map the right machines and level of integration.